MetaTrader 4 is a world-famous trading platform that allows traders to trade in Forex, stocks, and CFDs. It is one of the most popular platforms due to its reliability and ease of use. This article will discuss five must-know tips for using MetaTrader 4.
Table of Contents
The basics
Regarding trading in the financial markets, there are a few basic things that all traders need to know to be successful. One of the most important is how to open and close positions. This includes setting stop losses and taking profits to limit your risk and lock in profits. Another essential thing to know is how to manage your money. This means understanding things like risk management and position sizing. Lastly, it’s also important to have a good understanding of the markets you’re trading in. This includes knowing what factors can affect price movements and being aware of any upcoming events that could impact the market.
How to use indicators to help you make trading decisions
As any trader knows, making sound decisions is essential to market success. However, with the ever-changing nature of the markets, it can be difficult to know when to buy or sell. One way to make more informed decisions is to use indicators. Indicators are tools that help to analyze past price data and provide insight into possible future movements. There are a variety of different indicators available, and each one can be used in different ways. For example, some indicators may be more effective in identifying short-term trends, while others may be better suited for identifying long-term patterns. As a result, by combining different indicators, traders can get a complete picture of the market and make more informed decisions.
How to use charts to identify trading opportunities
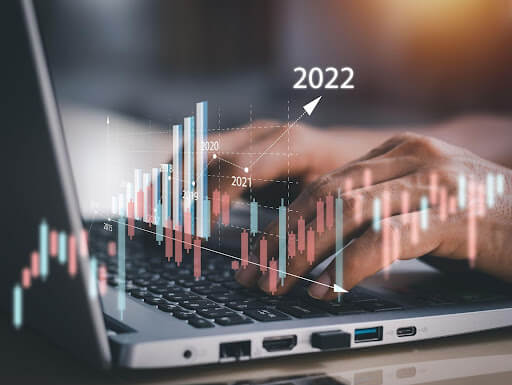
Charts are an essential tool for any trader. Tracking price changes over time can help identify patterns and trends that may indicate future movements. There are various charts, but the most popular are candlestick charts. These charts provide a clear and concise way to visualize price action, making them ideal for identifying trading opportunities. To read a candlestick chart, each “candle” represents the price action for a specific period, with the body representing the open and closed prices and the wicks representing the high and low prices. Bullish candles have green bodies, and bearish candles have red bodies. When candlesticks are stacked on top of each other, it can indicate either a trend or consolidation. If the candlesticks are primarily green, buyers are in control, and prices are likely to increase. Conversely, if the candlesticks are primarily red, it suggests that sellers are in control and prices are likely to continue moving lower. As such, charts can be a precious tool for any trader looking to identify potential trading opportunities.
One Click Trading
If you’re the type of trader who wants to place trades quickly, one-click trading is perfect for you as it reduces trading time.
Currently, the way to place a trade on MT4 is in two steps. The first step is to bring up a trade order window. The second step is to select an appropriate order type and confirm your order submission. You must complete both steps in order for your submission to be processed.
The One Click Trading mode on MetaTrader is a streamlined, one-step process for submitting orders. With this method, your order will be submitted when you:
If you want to SELL, click the bid rate button. If you want to BUY, click the ask rate button.
After you click, there will be no confirmation prompt to withdraw or change your order.
You can activate or deactivate One Click Trading mode on either the Trade tab or Options window within the terminal.
Display Profit in terms of Points, Terms of Currency or Base Currency
The Terminal window defaults to viewing profit and loss in the Base (Deposit) Currency. For example, if your trading account is in Australian Dollars (AUD), and you were trading Euros to US dollars (EURUSD), the profit & loss would automatically be displayed in AUD. You can also observe your profit & loss in either Points or Currency.
Conclusion
Whether you are a beginner or an experienced trader, understanding how to use charts and indicators can help improve your trading accuracy. Tracking price changes over time make it possible to identify potential opportunities and trends that may predict future movements in the market. Several useful tools, such as one-click trading and displaying profit in points or terms of currency, can make placing orders quicker and easier. Whether you trade stocks, currencies, commodities or indices, understanding the basics of charting and technical analysis will help you become a more successful trader. As a trader looking for new trading opportunities, it is important to know how to use charts effectively. Charts provide traders with valuable information about past movements in order to predict future movements better.